US Department of Commerce
Creating and Taking a Survey
Individuals learn how to conduct surveys and collect data for the class on age, pets, and number of people at home. Scholars compare their household size to the information in the census. Pupils then develop additional questions to ask...
American Statistical Association
Chocolicious
To understand how biased data is misleading, learners analyze survey data and graphical representations. They use that information to design their own plans to collect information on consumer thoughts about Chocolicious cereal.
Mathematics Vision Project
Module 8: Statistics
What does it mean to be normal in the world of statistics? Pupils first explore the meaning of a normal distribution in the eight-lesson module. They then apply the statistics related to normal distributions such as mean, standard...
Google
Graphing with Google Docs & Forms
Get to know your class and teach about data analysis all with the help of Google Docs. Using student-generated questions, create a class survey using Google Forms. Reserve time in the computer lab for learners to complete the form and,...
Noyce Foundation
Through the Grapevine
Teach statistics by analyzing raisins. A thorough activity provides lesson resources for five levels to include all grades. Younger pupils work on counting and estimation, mid-level learners build on their understanding of the measures...
West Contra Costa Unified School District
Introduction to Conditional Probability
Here is a turnkey lesson that walks young statisticians through the development and uses of conditional probability. From dice games to surveys, Venn diagrams to frequency tables, the class learns how a given can effect the overall...
Willow Tree
Data Sampling
Some say that you can make statistics say whatever you want. It is important for learners to recognize these biases. Pupils learn about sample bias and the different types of samples.
CK-12 Foundation
Understand and Create Stem-and-Leaf Plots: Event Survey
A good lesson doesn't just grow on trees! Help your classes understand the concept of a stem-and-leaf plot using an interactive lesson. Learners first create a stem-and-leaf plot from a set of data by dragging the values to the plot....
Northwest Career & Technical Academy Foundation
Stand Up. . . Be InCtrl!
What is the difference between a bystander and an upstander? A collaborative project created through digital media helps the class understand that they can participate in an online community respectfully and responsibly. They consider...
Curated OER
Hand Span and Height
Is there a relationship between hand span width and height? Statisticians survey each other by taking measurements of both. A table that can hold data for 24 individuals is printed onto the worksheet, along with questions for analysis....
Federal Reserve Bank
The Fed Is Protecting Your Money
A dollar bill, a check, a credit card, and... a cow? What exactly are the various forms of payment that exist today? Your learners will identify the three functions of money in this lesson. In addition, they will discover the most common...
EngageNY
Estimating Probability Distributions Empirically 1
What if you don't have theoretical probabilities with which to create probability distributions? The 11th installment of a 21-part module has scholars collecting data through a survey. The results of the survey provide empirical data to...
Missouri Department of Elementary
How Much Does Smoking Really Cost?
Following a brief survey about tobacco, scholars examine a fact sheet to answer questions about the substance. A practice page challenges the class to determine the cost of the habit using money math. Pupils discuss their findings...
Pimsleur
Food and Friends
After an initial sharing of and discussion about favorite foods, individuals or partners create surveys about food. Spanish language learners must include several comparative questions in their surveys. Once everyone has gathered...
American Psychological Association
Statistical Significance
Our survey says ...! High school psychology scholars analyze how people create surveys. Three different scenarios help them discover the meaning behind statistical significance. Armed with new knowledge, novice psychologists uncover what...
Math Worksheets Land
Pie or Circle Graphs—Step-by-Step Lesson
How do you display data that you've collected in a pie chart? Follow a clear step-by-step guide to turning survey results into a visible format. It shows kids how to determine the percentage of the whole that each section represents.
Council for the Curriculum, Examinations and Assessment
Learning About Learning
Successful people know that they never stop learning. Eighth graders explore their preferred ways to learn new information with a reflective lesson about learning styles, that features surveys, writing prompts, and discussion questions.
Virginia Department of Education
May I Have Fries with That?
Not all pie graphs are about pies. The class conducts a survey on favorite fast food categories in a lesson on data representation. Pupils use the results to create a circle graph.
Delaware Coalition Against Domestic Violence
Healthy Relationships
Teach tweens and teens how to prevent dating and domestic violence with a unit on healthy relationships. The unit begins with class members taking a relationships survey. As the unit progresses, class members engage in activities that...
EngageNY
Types of Statistical Studies
All data is not created equal. Scholars examine the different types of studies and learn about the importance of randomization. They explore the meaning of causation and when it can be applied to data.
Mathematics Vision Project
Module 9: Statistics
All disciplines use data! A seven-lesson unit teaches learners the basics of analyzing all types of data. The unit begins with a study of the shape of data displays and the analysis of a normal distribution. Later lessons discuss the...
EngageNY
Summarizing Bivariate Categorical Data in a Two-Way Table
Be sure to look both ways when making a two-way table. In the lesson, scholars learn to create two-way tables to display bivariate data. They calculate relative frequencies to answer questions of interest in the 14th part of the series.
Illinois Department of Natural Resources
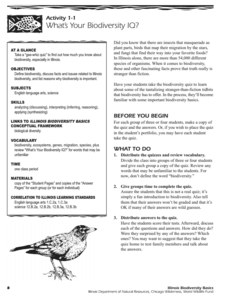
Section One: What is Biodiversity?
Four intriguing and scientific activities invite learners to explore the natural resources of their town. The activities cover concepts such as genetic traits, organizing species in a taxonomy, the differences between different species...
Henry Ford Museum
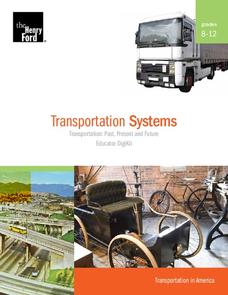
Transportation Systems
Learners analyze the evolution of cultural attitudes through the lens of transportation, examining several artifacts, documents, and photographs. Topics covered include how American attitudes have influenced society's evolution into a...
Other popular searches
- Health and Fitness Surveys
- Surveys and Bar Graphs
- Surveys of Favorite Foods
- Mean Median Mode Surveys
- Designing Surveys
- Opinion Surveys
- Data Tables Surveys
- Surveys and Sampling
- Surveys and Graphs
- Interest Surveys
- Writing Surveys
- Land Surveys


