Mathematics Assessment Project
Interpreting Distance–Time Graphs
Pre-algebra protégés critique a graph depicting Tom's trip to the bus stop. They work together to match descriptive cards to distance-time graph cards and data table cards, all of which are provided for you so you can make copies for...
Curated OER
Creating a Thematic Map
Students create and analyze a weather-related data table and a thematic map based upon information provided.
Curated OER
Scaling it Down: Caves Have Maps, Too
Measurement and map skills are the focus of this lesson, where students crawl through a "cave" made out of boxes, desks and chairs, observing the dimensions. Your young geographers measure various aspects of the cave and practice math...
Curated OER
Use Google Maps to Teach Math
Capture the engagement of young mathematicians with this upper-elementary math lesson on measuring time and distance. Using Google Maps, students first measure and compare the distance and time it takes to travel between different...
Curated OER
Grid Frame Mapping
Students map and describe small area of the schoolyard and discuss habitats.
Polar Trec
Playground Profiling—Topographic Profile Mapping
The Kuril islands stretch from Japan to Russia, and the ongoing dispute about their jurisdiction prevents many scientific research studies. Scholars learn to create a topographic profile of a specific area around their schools. Then they...
Curated OER
Representing Data 1: Using Frequency Graphs
Here is a activity that focuses on the use of frequency graphs to identify a range of measures and makes sense of data in a real-world context as well as constructing frequency graphs given information about the mean, median, and range...
Museum of Science
Make a Map
It's important to know the final destination. Scholars first measure distances in a region of interest using a standard measuring device or by counting steps. They then use an appropriate scale and graph paper to create a map of the...
NOAA
Wet Maps
How do oceanographers make maps under water? Junior explorers discover the technologies and processes involved in creating bathymetric maps in part three of a five-part series designed for fifth- and sixth-grade pupils. The lesson...
NASA
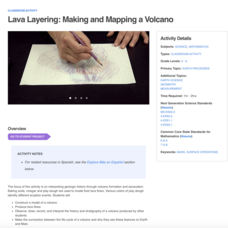
Lava Layering: Making and Mapping a Volcano
Looking for an out-of-this-world volcanic activity? Geologists study Earth's volcanic history and the neighboring planet Mars by modeling volcanic eruptions, lava flows, and building a shield volcano. Participants use graph paper and...
Curated OER
Maps and Modes, Finding a Mean Home on the Range
Fifth graders investigate data from maps to solve problems. In this data lesson, 5th graders study maps and collect data from each map. Students present their data in a variety of ways and calculate the mode, mean, median, and range.
Computer Science Unplugged
The Poor Cartographer—Graph Coloring
Color the town red. Demonstrate the concept of graph theory with a task that involves determining the least number of colors needed to color a map so that neighboring countries are not represented by the same color. Pupils make...
CK-12 Foundation
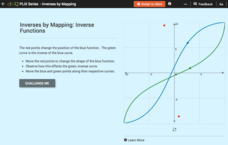
Inverses by Mapping: Inverse Functions
Map your way to successfully understanding inverse functions. Pupils use an interactive map to investigate how changes in the graph of a function affect the graph of its inverse. The results of the activity lead to the conclusion that...
Curated OER
Mapping the Past
Students study historical maps to view how the world evolved from medieval times through the Renaissance. They work in groups to examine the maps and present a report on one of the listed maps.
Curated OER
Mapping Perceptions of China
Students discuss what types of things are included on a map. They compare and contrast maps of China with a map they create and practice using different types of maps. They write analysis of their classmates maps.
Mathematics Assessment Project
Representing Quadratic Functions Graphically
Sometimes being different is an advantage. An engaging activity has scholars match cards with quadratic functions in various forms. Along the way, they learn about how each form highlights key features of quadratic functions.
Virginia Department of Education
Functions 1
Scholars learn what it means for a relation to be a function and see various representations of functions. After learning the definition, they participate in a card sorting activity classifying relations as functions or not.
NASA
Analyzing Surface Air Temperatures by Latitude: Student Activity
Explore global temperatures from the comfort of your learning place! Meteorologists analyze surface temperatures and anomalies across different latitudes. Investigators evaluate graphs to find temperature differences and answer questions...
Curated OER
Using Graphs
Print and use this useful unit on basic algebraic functions, domain, range, and graphing. Tasks include, illustrating simple functions with a graph, and identifying the domain and range of the function. This twelve-page packet contains...
Curated OER
Algebra: Coordinates and Straight Line Graphs
Young mathematicians review what they have previously learned about coordinates and straight line graphs. Then, they access an interactive component within the lesson to gain more practice with this skill. Additionally, there are two...
Teach Engineering
Complex Networks and Graphs
Show your class how engineers use graphs to understand large and complex systems. The resource provides the beginnings of graph theory by introducing the class to set theory, graphs, and degree distributions of a graph.
California Academy of Science
California's Climate
The United States is a large country with many different climates. Graph and analyze temperature and rainfall data for Sacramento and Washington DC as you teach your class about the characteristics of Mediterranean climates. Discuss the...
PBS
Working with Coordinate Planes: Activities and Supplemental Materials
Seven activities make up a collection of supplemental materials to reinforce graphing on a coordinate plane. Worksheet objectives include plotting coordinates within single and four quadrants, measuring straight and diagonal lines, and...
Mathematics Assessment Project
Matching Situations, Graphs and Linear Equations
What do guitars, candles, and helicopters have in common? They're all in this resource. Learners complete an assessment task to determine the amount of profit made in a guitar class based on given information regarding variable...


