Shodor Education Foundation
InteGreat!
Take a great look at integration! Young scholars use an interactive to learn how to integrate a function. Learners input a function and view the integral as well as see a graphical representation.
CK-12 Foundation
Location on the Earth: Longitude and Latitude
To what degree do learners understand coordinates? Get them some practice in Yosemite National Park in a simple, fun interactive. Pupils explore a map and locate coordinates of popular sights within the park, then answer questions...
PBS
Mountains and Rain Shadows
Scholars use an online interactive to learn just how different the other side of the mountain actually appears. They use satellite images, graphics, and videos to compare the impact of winds, oceans, clouds, precipitation, and more on...
Shodor Education Foundation
Multiple Linear Regression
You'll have no regrets when you use the perfect lesson to teach regression! An interactive resource has individuals manipulate the slope and y-intercept of a line to match a set of data. Learners practice data sets with both positive and...
Concord Consortium
Exploring Electron Properties
Bring a historic chemistry experiment to life in your classroom! Introduce pupils to Thompson's ground-breaking discovery of the electron through a cathode ray simulation. The resource allows users to study the behavior of both electrons...
Shodor Education Foundation
Box Plot
What information can come from a box? Learners choose a data set to display as a box plot and decide whether to include the median in the calculation of the quartiles, show the outliers, and change the scale. To finish the lesson,...
Shodor Education Foundation
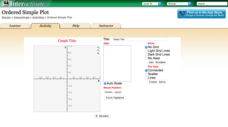
Ordered Simple Plot
Open your imagination to make algebra-inspired creations. An interactive lesson has scholars graph images from a set of parameters. Users can practice minimum values, maximum values, and scale as well as key features.
Shodor Education Foundation
Linear Inequalities
An interactive lesson helps individuals learn to graph inequalities in two variables. Scholars can adjust the interactive to present the inequalities in standard or slope-intercept form.
Shodor Education Foundation
Multi-Function Data Flyer
Explore different types of functions using an interactive lesson. Learners enter functions and view the accompanying graphs. They can choose to show key features or adjust the scale of the graph.
Shodor Education Foundation
Experimental Probability
Spin into a dicey experiment. Pupils use a spinner or a pair of dice to determine the experimental probabilities of each outcome. The interactive allows for either, one, five, or ten consecutive experiments. Using the applet, learners...
Shodor Education Foundation
Measures
Take a look at data from a statistical lens. An interactive allows pupils to enter data set, labeling the data including the units used. Manipulating the applet, learners select the statistics to calculate that include total, mean,...
Shodor Education Foundation
Transmographer
Introducing ... the Transmographer. Young mathematicians investigate translations, reflections, and rotations. The applet lets users perform transformations on triangles, squares, and parallelograms.
Shodor Education Foundation
Algebra Quiz
Reviewing the process of solving equations is as easy as one click of a button. Scholars solve linear and quadratic equations by using a helpful interactive. The computer app automatically scores responses, providing immediate feedback...
Shodor Education Foundation
Incline
Study velocity while examining graphical representations. As scholars work with the animation, they discover the effect the height of an incline has on the velocity of the biker. They make conclusions about the slope of the...
Shodor Education Foundation
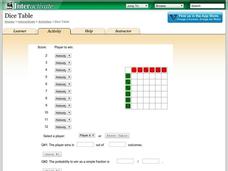
Dice Table
Convert a table to probabilities. Pupils set up the winning rules for the sums of two dice. Using the rules, the applet fills out a table showing the winners for each combination. Learners determine the probabilities of winning for each...
Shodor Education Foundation
Scatter Plot
What is the relationship between two variables? Groups work together to gather data on arm spans and height. Using the interactive, learners plot the bivariate data, labeling the axes and the graph. The resource allows scholars to create...
Shodor Education Foundation
Two Variable Function Pump
Use a function to operate on two variables. Pupils look at operating with complex numbers as a function of two variables. The interactive squares the input and adds a constant to it. Learners visualize the resulting output and its...
Shodor Education Foundation
Vertical Line Test
Connect the points to create a function. Using points given by the applet, pupils try to connect them to create a line that would pass the vertical line test. The resource keeps track of the number of sets the learner is able to identify...
Shodor Education Foundation
Overlapping Gaussians
Adjust the overlap to compare probabilities. Using sliders, learners adjust the shape of two Gaussian curves. The interactive calculates the area of the left tail for one curve and the right tail for the other. Pupils set the interactive...
Shodor Education Foundation
Rabbits and Wolves
A change in a parameter can end in overpopulation. The resources gives pupils the opportunity to control the parameters of rabbits and wolves in a natural setting. Using the set parameters, the simulation runs and displays the population...
Shodor Education Foundation
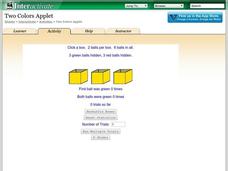
Two Colors Applet
Find the box with two green balls. The applet uses six balls, three green and three red, and hides them in three boxes. Pupils choose a box and click on it to reveal the color of balls inside. Using the chosen box, the simulation keeps...
Shodor Education Foundation
Pythagorean Explorer
Make sure the measurement is right. The interactive provides right triangles with a missing side measurement. Pupils use the given sides and the Pythagorean Theorem to calculate the length of the missing side. After entering the length,...
Shodor Education Foundation
Stem and Leaf Plotter
The key is in the leaves. Pupils enter data to create a stem-and-leaf plot. The resource then displays the plot and calculates the mean, median, and mode of the data. Using the plot and the calculated measures of spread, learners analyze...
Shodor Education Foundation
Sequencer
Take the first step into graphing sequences. Learners set the starting number, multiplier, add-on, and the number of steps for a sequence. Using the inputs, the interactive calculates and plots the sequence on the coordinate plane. Users...


