Hi, what do you want to do?
Charleston School District
Analyzing Scatter Plots
Scatter plots tell a story about the data — you just need to be able to read it! Building from the previous lesson in the series where learners created scatter plots, they now learn how to find associations in those scatter plots....
Willow Tree
Scatterplots and Stem-and-Leaf Plots
Is there a correlation between the number of cats you own and your age? Use a scatter plot to analyze these correlation questions. Learners plot data and look for positive, negative, or no correlation, then create stem-and-leaf plots to...
Willow Tree
Line Plots
You can't see patterns in a jumble of numbers ... so organize them! Learners take a set of data and use a line plot to organize the numbers. From the line plot, they find minimum, maximum, mean, and make other conclusions about the...
Charleston School District
Constructing Scatter Plots
Having more letters in your name helps you get a better grade in your math class—or does it? Learners create scatter plots to organize data. The lesson places emphasis on determining scale and intervals and labeling axis.
Willow Tree
Box-and-Whisker Plots
Whiskers are not just for cats! Pupils create box-and-whisker plots from given data sets. They analyze the data using the graphs as their guide.
Charleston School District
The Line of Best Fit
If it's warm, they will come! Learners find a line of best fit to show a relationship between temperature and beach visitors. Previous lessons in the series showed pupils how to create and find associations in scatter plots. Now,...
Charleston School District
Graphing Functions
How do letters and numbers create a picture? Scholars learn to create input/output tables to graph functions. They graph both linear and nonlinear functions by creating tables and plotting points.
Agriculture in the Classroom
A Holiday Tradition: Which Christmas Tree Will You Choose?
Different varieties of Christmas trees provide an interesting way to combine social studies, science, math, and technology. Class members not only research the history of the Christmas tree holiday tradition, they compare and...
Thomson Brooks-Core
Complex Numbers
A straightforward approach to teaching complex numbers, this lesson addresses the concepts of complex numbers, polar coordinates, Euler's formula, De moivres Theorem, and more. It includes a practice problems set with odd answers...
Charleston School District
Solving Systems Graphically
When guess and check gets old, it's time to start graphing! An instructive lesson explains how to solve a system of linear equations using graphing. Equations are in both slope-intercepts and standard form.
Virginia Department of Education
How Much is that Tune?
Tune in for savings! Scholars investigate pricing schemes for two different online music download sites. After comparing the two, they determine the numbers of songs for which each site would be cheaper.
Willow Tree
Approximating a Line of Best Fit
You may be able to see patterns visually, but mathematics quantifies them. Here learners find correlation in scatterplots and write equations to represent that relationship. They fit a line to the data, find two points on the line, and...
Willow Tree
Graphing
So many methods and so little time! The efficient method of graphing a linear equation depends on what information the problem gives. Pupils learn three different methods of graphing linear equations. They graph equations using...
Willow Tree
Midpoint and Distance Formulas
The shortest distance between two points is a straight line. Learners use the Pythagorean Theorem to develop a formula to find that distance. They then find the midpoint using an average formula.
West Contra Costa Unified School District
Sneaking Up on Slope
Pupils determine the pattern in collinear points in order to determine the next point in a sequence. Using the definition of slope, they practice using the slope formula, and finish the activity with three different ways to...
Willow Tree
Linear Relationships
There's just something special about lines in algebra. Introduce your classes to linear equations by analyzing the linear relationship. Young mathematicians use input/output pairs to determine the slope and the slope-intercept formula to...
Willow Tree
Circle Graphs
Pie isn't just for eating! Scholars learn to create pie charts and circle graphs to represent data. Given raw data, learners determine the percent of the whole for each category and then figure out the degree of the circle that percent...
Willow Tree
Line Graphs
Some data just doesn't follow a straight path. Learners use line graphs to represent data that changes over time. They use the graphs to analyze the data and make conclusions.
Mary Pope Osborne, Classroom Adventures Program
Mummies in the Morning Egyptian pyramids, hieroglyphics
Visit the Magic Treehouse and take your class on a trip through time with a reading of the children's book Mummies in the Morning. Using the story to spark an investigation into Egyptian culture, this literature unit engages...
Math Is Fun
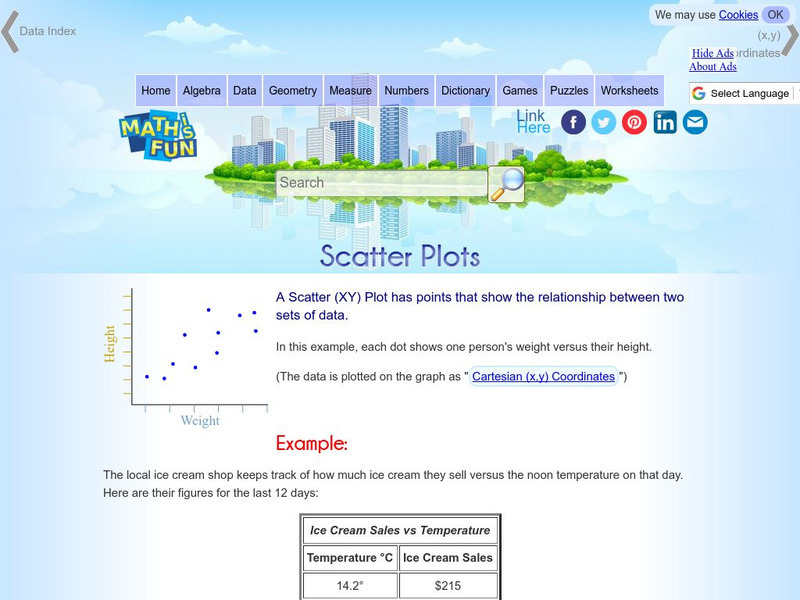
Math Is Fun: Scatter Plots
Explains, with examples, what scatter plots are and how to interpret the data. Discusses trends, interpolation and extrapolation, and correlation. Includes a set of practice questions.
Quia
Ixl Learning: Scatter Plots
Brush up on your math skills relating to scatter plots then try some practice problems to test your understanding.
Wolfram Research
Wolfram Math World: Complex Plane
This math site gives a visual representation of a complex plane with several values plotted, the site explains that any complex number can be plotted on such a plane. The site contains links to related words and topics.
Math Is Fun
Math Is Fun: Stem and Leaf Plots
Explains, with examples, what stem and leaf plots are. Includes a set of practice questions.
Quia
Ixl Learning: Dot Plots
Brush up on your math skills relating to dot plots then try some practice problems to test your understanding.


