Curated OER
It's Greek to Me!
Use Greek roots, suffixes, and prefixes to create polysyllabic words. Readers use the dictionary to identify what the word's prefix, suffix, and root or base word mean. They define what a syllable is and how one is formed using Greek...
Curated OER
Data Analysis
Young statisticians use and interpret measures of center and spread such as mean, median, and mode as well as range. They use box plots to represent their data and answer questions regarding the correspondence between data sets and the...
Curated OER
Starting With Stats
Statisticians analyze a data set of student IQs by finding measures of central tendency and dispersion such as mean, median, mode, and quartiles. They practice using a graphing calculator to find the values and analyze box plots and...
Radford University
The Normal Distribution Activity
For whom does the bell fit? Pupils begin by working in groups gather data on three different variables. They then determine the mean and standard deviation of each data set and create bell curves. To finish, they answer guiding questions...
American Chemical Society
Setting the Standards of Excellence
A number doesn't have much meaning without a standard of reference. Learners read about the history of developing standards to measure chemical and physical properties and complete reading guides to process the information. They focus on...
Radford University
What is My Standing Height Wise?
Given a scenario in which a class member wants to prove his height is not an outlier, pairs devise a plan and gather evidence to help support his claim. The small groups implement their plans and create graphical displays of their data...
US Department of Commerce
Over the Hill - Aging on a Normal Curve
Nobody is too old to learn something new. Young statisticians analyze census data on the percentage of the population older than 65 years old in US counties. They fit a normal distribution to the data, determine the mean and standard...
Curated OER
Double Dip: Using Multi-Meaning Words
Double dip ice cream cones are a fourth grade favorite, and now they come in vocabulary and context flavor. Learners practice using double meaning words as they construct ice cream cones that contain two sentences showing how context can...
EngageNY
Margin of Error When Estimating a Population Mean (part 2)
Don't leave your classes vulnerable in their calculations! Help them understand the importance of calculating a margin of error to represent the variability in their sample mean.
Statistics Education Web
Walk the Line
How confident are you? Explore the meaning of a confidence interval using class collected data. Learners analyze data and follow the steps to determine a 95 percent confidence interval. They then interpret the meaning of the confidence...
Virginia Department of Education
Organizing Topic: Data Analysis
Learners engage in six activities to lead them through the process of conducting a thorough analysis of data. Pupils work with calculating standard deviations and z-scores, finding the area under a normal curve, and sampling techniques....
Curriculum Corner
“I Can” Common Core! 1st Grade Language
Support first graders with developing their basic language skills using this Common Core checklist. With each standard rewritten as a positive I can statement, students are encouraged to work hard toward reaching these clear learning...
EngageNY
Margin of Error When Estimating a Population Mean (part 1)
We know that sample data varies — it's time to quantify that variability! After calculating a sample mean, pupils calculate the margin of error. They repeat the process with a greater number of sample means and compare the results.
EngageNY
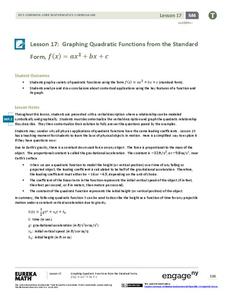
Graphing Quadratic Functions from the Standard Form
Use context to explain the importance of the key features of a graph. When context is introduced, the domain and range have meaning, which enhances understanding. Pupils use application questions to explore the key features of the graph...
Bozeman Science
NGSS Practice Posters
Begin the year with an emphasis on the NGSS practice standards. The resource provides an 8x10 size poster for each standard. When hung in a classroom, learners have a consistent reminder of what it means to be a scientist.
Noyce Foundation
Ducklings
The class gets their mean and median all in a row with an assessment task that uses a population of ducklings to work with data displays and measures of central tendency. Pupils create a frequency chart and calculate the mean and median....
EngageNY
Measuring Variability for Symmetrical Distributions
How do we measure the deviation of data points from the mean? An enriching activity walks your class through the steps to calculate the standard deviation. Guiding questions connect the steps to the context, so the process is not about...
Noyce Foundation
Baseball Players
Baseball is all about statistics. Pupils solve problems related to mean, median, and range. They calculate the total weight of players given the mean weight, calculate the mean weight of reserve players given the mean weight of the...
Shodor Education Foundation
Skew Distribution
Slide the class into a skewed view. Learners alter the location of the median relative to the mean of a normal curve to create a skew distribution. They compare the curve to a histogram distribution with the same skewness.
American Statistical Association
Bear Hugs
Scholars research arm span to determine who gives the best bear hugs. They use data from a national study to find the standard statistics for arm span. It includes mean, median, quartiles, spread, standard deviation, and more.
Georgia Department of Education
Math Class
Young analysts use real (provided) data from a class's test scores to practice using statistical tools. Not only do learners calculate measures of center and spread (including mean, median, deviation, and IQ range), but also use this...
EngageNY
Describing the Center of a Distribution
So the mean is not always the best center? By working through this exploratory activity, the class comes to realize that depending upon the shape of a distribution, different centers should be chosen. Learners continue to explore the...
Teach Engineering
Earthquakes Living Lab: Locating Earthquakes
There are patterns in nearly everything — even earthquakes. Pairs research current earthquakes to see if there are any patterns. They determine the mean, median, and mode of the earthquake data, along with the maximum and minimum. Using...
Shodor Education Foundation
Plop It!
Build upon and stack up data to get the complete picture. Using the applet, pupils build bar graphs. As the bar graph builds, the interactive graphically displays the mean, median, and mode. Learners finish by exploring the changes in...


