Curated OER
Get a Half Life!: Student Worksheet
Upper elementary or middle schoolers will explore non-linear functions, graphing, and the curve of best fit through real-life data collection and trial analysis. They explore the concept of half-life and radioactive decay using M&Ms,...
Curated OER
A "Sedimental" Journey-Sediment Collection
Students are asked how they would gather a sample of sediment from a lake, stream, river, pond, or swamp. They discuss safety concerns involving sample collections. Students are instructed to stay out of the water and to be careful not...
University of Waikato
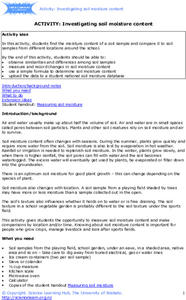
Investigating Soil Moisture Content
Class members analyze the water content in soil samples by drying out the samples and taking measurements every minute until all the moisture is gone. Scholars compare the initial weight to the dried weight to calculate the percentage of...
Reading for Meaning
Sample Lessons and Worksheets
If you need to bulk up your reading comprehension worksheet collection, take a look at a resource that includes graphic organizers and reading comprehension questions. The series of 50 worksheets addresses novels such as Julie of the...
CCSS Math Activities
Smarter Balanced Sample Items: High School Math – Claim 2
Problem solve across the content standards. The presentation slides provide 19 sample items from the Smarter Balanced high school assessment. Items illustrate Claim 2, problem solving, of the test and are drawn from all the high school...
Kenan Fellows
Designing and Analyzing Data Collected from Wearable Devices to Solve Problems in Health Care
Wearable devices have become more the norm than the exception. Learners analyze data from a sample device with a regression analysis in a helpful hands-on lesson. Their focus is to determine if there is a connection between temperature...
Curated OER
Stream Consciousness
Actual stream water is analyzed in this environmental science activity. Participants measure water temperature and pH, and then survey the macroinvertebrates living in their samples. The data worksheet, troubleshooting tips, and...
Curated OER
Collecting Data to Learn About the People Around You
Human graphs, anyone? Did you eat fruit today? What is your favorite costume? Have your K – 6 learners graph the responses. Early elementary grades may count and compare while upper grades compare responses of different groups or make...
McGraw Hill
Phonics Teachers Resource Book
Looking to improve your classes literacy program? Then look no further. This comprehensive collection of resources includes worksheets and activities covering everything from r-controlled vowels and consonant digraphs, to the different...
Curated OER
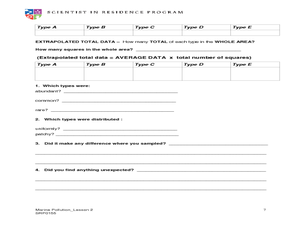
Scientific Sampling
Learners take a sample of fish and try to determine how many fish are in the sea. In this scientific sampling lesson, students explore the way scientists measure large areas of samples. Learners record the distribution in a quadrant.
Curated OER
Sampling Rocks
Young scholars analyze rocks. In this geology lesson, students collect rocks from the schoolyard and sort them according to various characteristics, such as color, size, and weight.
Statistics Education Web
Population Parameter with M-and-M's
Manufacturers' claims may or may not be accurate, so proceed with caution. Here pupils use statistics to investigate the M&M's company's claim about the percentage of each color of candy in their packaging. Through the activity,...
EngageNY
Understanding Variability When Estimating a Population Proportion
Estimate the proportion in a population using sampling. The 20th installment in a series of 25 introduces how to determine proportions of categorical data within a population. Groups take random samples from a bag of cubes to determine...
American Statistical Association
An A-MAZE-ING Comparison
Teach your class how to use descriptive statistics through a hands-on data collection activity. Pupils collect their own data, calculate test statistics, and interpret the results in context. They compare male and female results, looking...
American Statistical Association
Colors Challenge!
Does writing the name of a color in a different colored ink affect one's ability to read it? Scholars design an experiment to answer this question. They collect the data, analyze the statistics, and draw a conclusion based on what they...
American Statistical Association
How Fast Are You?
Quick! Snap up the lesson. Scholars first use an online app to collect data on reaction times by clicking a button when the color of a box changes. They then plot and analyze the data by considering measures of center, measures of...
Inside Mathematics
Winning Spinners
Winning a spin game is random chance, right? Pupils create a table to determine the sample space of spinning two spinners. Individuals determine the probability of winning a game and then modify the spinners to increase the probability...
Code.org
Introduction to Data
Data, data everywhere. Challenge your class to begin thinking about data, the ways people collect information, and what we can learn from this data. Class members discuss sources of data and then individuals answer questions in the class...
Statistics Education Web
How High Can You Jump?
How high can your pupils jump? Learners design an experiment to answer this question. After collecting the data, they create box plots and scatter plots to analyze the data. To finish the instructional activity, they use the data to...
Preswick House
Teaching Unit: Invisible Man
Invisible Man is a core text in high school literature classes and one of the most cited works on the AP Literature and Composition exam. Instructors new to using Ralph Ellison's novel and those who have long included it as part of their...
Statistics Education Web
Walk the Line
How confident are you? Explore the meaning of a confidence interval using class collected data. Learners analyze data and follow the steps to determine a 95 percent confidence interval. They then interpret the meaning of the confidence...
EngageNY
Drawing a Conclusion from an Experiment (part 1)
Challenge your classes to complete an experiment from beginning to end. Learners make their own hypotheses, collect and analyze their own data, and make their own conclusions. They are on their way to becoming statisticians!
National Science Teacher Association
Middle School Sampler: Science
Focus on inquiry-based learning in your science class with a series of activities designed for middle schoolers. A helpful packet samples four different texts, which include activities about predator-prey relationships, Earth's axis and...
Curated OER
Surveys and Samples
For this surveys and samples worksheet, students discover data collection techniques and write their own survey questions. Students use random sampling, convenience sampling, and systemic sampling and analyze their results.


