Virginia Department of Education
Curve of Best Fit
Which function models the data best? Pupils work through several activities to model data with a variety of functions. Individuals begin by reviewing the shapes of the functions and finding functions that will fit plotted data points. By...
Virginia Department of Education
Functions: Domain, Range, End Behavior, Increasing or Decreasing
Examine key features of various functions through exploration. A comprehensive lesson has learners describe the domain, range, end behavior and increasing/decreasing intervals of various functions. Function types include linear,...
Virginia Department of Education
Equations of Lines
Scholars connect slope-intercept form and standard form to the values of m and b by first matching a set of cards that have slope-intercept form, standard form, values of m, values of b, and graphs of linear equations. They then play a...
Virginia Department of Education
Inequalities
Compare graphing an inequality in one variable on a number line to graphing an inequality in two variables on a coordinate plane. Young mathematicians work on a puzzle matching inequalities and their solutions. They then complete a...
Virginia Department of Education
Rational Functions: Intercepts, Asymptotes, and Discontinuity
Discover different patterns by making connections between a rational function and its graph. An engaging lesson asks scholars to explore the behavior of different rational functions. Groups discover a connection between the function and...
Virginia Department of Education
Transformational Graphing
Find relationships between the structure of a function and its graph. An engaging lesson explores seven parent functions and their graphs. Learners match functions to their graphs and describe transformations.
Virginia Department of Education
Nonlinear Systems of Equations
Explore nonlinear systems through graphs and algebra. High schoolers begin by examining the different types of quadratic functions and their possible intersections. They then use algebraic methods to solve systems containing various...
02 x 02 Worksheets
Absolute Value Equations and Inequalities
Demonstrate the meaning of an absolute inequality using three different methods. Here, scholars explore absolute value inequalities through graphing, number line distance, and compound inequalities. Pupils complete various activities to...
Mathed Up!
Negative Scale Factor
Class members investigate the effect of a negative scale factor dilation on coordinate shapes as they watch a short video that shows an example of a geometric figure undergoing a dilation with a negative scale factor. Learners then try a...
EngageNY
Waves, Sinusoids, and Identities
What is the net effect when two waves interfere with each other? The lesson plan answers this question by helping the class visualize waves through graphing. Pupils graph individual waves and determine the effect of the interference...
EngageNY
Revisiting the Graphs of the Trigonometric Functions
Use the graphs of the trigonometric functions to set the stage to inverse functions. The activity reviews the graphs of the basic trigonometric functions and their transformations. Pupils use their knowledge of graphing functions to...
EngageNY
Matrix Notation Encompasses New Transformations!
Class members make a real connection to matrices in the 25th part of a series of 32 by looking at the identity matrix and making the connection to the multiplicative identity in the real numbers. Pupils explore different matrices and...
Teach Engineering
Coordinates and the Cartesian Plane
The plot thickens to get a functional understanding. After a short review of plotting points on the coordinate plane, class members learn the difference between functions and relations in the second lesson in a series of nine. They show...
EngageNY
Exploiting the Connection to Trigonometry 2
The class checks to see if the formula for finding powers of a complex number works to find the roots too. Pupils review the previous day's work and graph on the polar grid. The discussion leads the class to think about how to reverse...
Chicago Teachers Union Quest Center
Factored Form of a Quadratic Function
Build upon linear functions to learn about quadratics. The lesson introduces the concept of zeros for quadratic functions and makes the connection to the linear factors of the function. It presents quadratics in both graphical and...
West Contra Costa Unified School District
Three Forms of an Equation of a Line
An equation is an equation is an equation. Scholars see there are many ways to solve them when they first sort a set of linear equations as written in standard form, point-slope form, or slope-intercept. They then write equations in all...
West Contra Costa Unified School District
Solving Systems of Inequalities
Don't throw away those transparency sheets just yet! Young scholars first review inequalities on a number line, then learn about graphing inequalities in the coordinate plane. Finally, they use overhead transparencies to create systems...
Curated OER
Building Functions
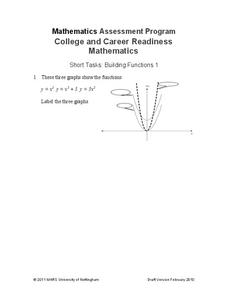
Pupils determine equations that match the graphs of transformations and the parent quadratic function. The resource requires class members to attend to precision and think abstractly.
Mathematics Assessment Project
Square
Don't be a square! Young mathematicians determine the slope and length of a line segment. They then prove whether four given coordinate points form a square.
Mathematics Assessment Project
Cubic Graph
Connect cubic graphs to equations. After connecting solutions of a cubic equation to zeros of its related cubic function, pupils investigate a translation of the cubic function.
Mathematics Assessment Project
Sorting Functions
There's no sorting hat here. A high school assessment task prompts learners to analyze different types of functions. They investigate graphs, equations, tables, and verbal rules for four different functions.
Mathematics Assessment Project
Printing Tickets
That's the ticket! Pupils write and investigate two linear functions representing the cost of printing tickets. Individuals then determine which of two printing companies would be a better buy.
Mathematics Assessment Project
Sugar Prices
Sugar rush! In this assessment task, learners interpret points on a scatter plot representing price versus weight for bags of sugar. They then determine the bag that represents the best value.
Mathematics Assessment Project
Sidewalk Patterns
Sidewalk patterns ... it's definitely not foursquare! Learners investigate patterns in sidewalk blocks, write an expression to represent the pattern, and then solve problems using the expressions.


