Mathed Up!
Distance Time Graphs
If only there was a graph to show the distance traveled over a period of time. Given distance-time graphs, pupils read them to determine the answers to questions. Using the distance and time on a straight line, scholars calculate the...
NASA
Resolving 3-Plane Traffic Conflicts by Changing Route—Problem Set C
Keep the planes from crashing. Pupils work with three airplanes and change their flight paths to keep them at a safe distance from each other. Individuals work through three problems in the third interactive in a set of six with...
NASA
Understanding the Effects of Differences in Speed—Problem Set D
Fall back and slow down. The fourth lesson in a six-part series on air traffic control leads the class to find the difference in distance traveled based upon the difference in speed. Pupils work through a problem related to walking...
NASA
Resolving 2-Plane Traffic Conflicts by Changing Speed—Problem Set E
What do you do to change arrival times of airplanes when a different route is not available? The fifth interactive in a series of six presents problems where pupils must find solutions to conflicts of safety rules. They must decide how...
EngageNY
Getting the Job Done—Speed, Work, and Measurement Units II
How fast is your class? Learners determine the amount of time it takes individuals to walk a given distance and calculate their speeds. Pupils solve distance, rate, and time problems using the formula and pay attention to the...
Worksheet Web
Learning About Rate
After reading a one-page passage on how to understand and solve distance/rate problems, young mathematicians answer six word problems that have them correctly set up the formula in order to solve for the distnace, rate, or time in the...
NASA
Resolving 3-Plane Traffic Conflicts by Changing Speed—Problem Set F
Get three planes to line up safely. Individuals work through a set of problems to eliminate spacing conflicts between three airplanes in flight. The pupils use their knowledge to change the airplanes' speed or route to meet a...
NASA
Resolving 2-Plane Traffic Conflicts by Changing Route—Problem Set B
Do pilots create appropriate spacing between aircraft by traveling a longer or shorter path? An interactive presents two airplanes that violate safety protocols. Pupils must determine how to change the path of one plane to create...
Noyce Foundation
Movin 'n Groovin
Examine the consequences of varying speed. An engaging set of five problem sets challenges young mathematicians by targeting a different grade level from K-12. In the initial lesson, scholars make conclusions about the time it...
Willow Tree
Weighted Averages
Mixtures, weighted percentages, and varying speeds make problem solving difficult. The resource give learners a strategy for tackling these types of problems effectively.
EngageNY
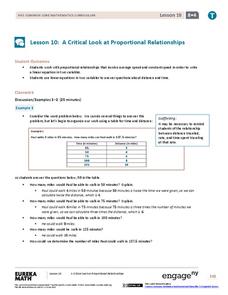
A Critical Look at Proportional Relationships
Use proportions to determine the travel distance in a given amount of time. The 10th installment in a series of 33 uses tables and descriptions to determine a person's constant speed. Using the constant speed, pupils write a linear...
Illustrative Mathematics
Friends Meeting on Bikes
It is the job of your mathematicians to figure out how fast Anya is riding her bike when meeting her friend. The problem shares the distance, time spent riding, and Taylor's speed leaving the last variable for your learners to solve. Use...
Balanced Assessment
All Aboard
Pupils must graph the location of a train using the time given a timetable. They analyze the different legs of the trip, graph the return trip, and compare the two graphs. The lesson ends with a discussion of similarities and...
Mathalicious
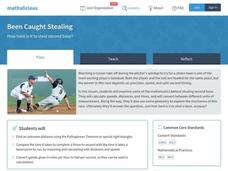
Been Caught Stealing
You're safe, when calculating the odds of stealing second base! Learners compare the rate of a runner to the distance the ball travels, in a lesson that explores right triangles and measurement. Full of discussion questions and fun...
Mathed Up!
Compound Measures
Compounding is dividing units. Pupils practice using compound measures such as units for speed and density to solve problems that range from straightforward speed problems to those requiring conversions. The last few items challenge...
Corbett Maths
Area under a Graph
What? The calculation of area is a linear distance? A short video shows how to use the areas of simple polygons to estimate the area under a graph. Pupils divide the area under a curve into figures to easier calculate the area. Given...
Under the Dome
The Fastest
The cheetah is faster than Bolt. Class members watch a video of a cheetah and Usain Bolt run at record breaking speeds. The pupils come up with questions about the video. When asked, the teacher provides information relative to the...
02 x 02 Worksheets
Inverse Variation
Discover an inverse variation pattern. A simple lesson plan design allows learners to explore a nonlinear pattern. Scholars analyze a distance, speed, and time relationship through tables and graphs. Eventually, they write an equation to...
Mr. E. Science
Motion
An informative presentation covers motion, metric system, conversions, graphing of coordinates and lines, speed, velocity, and acceleration problems, as well as mean calculations. This is the first lesson in a 26-part series.
Balanced Assessment
A Run for Two
Develop a graph to represent the distance between two cars. The assessment task presents a scenario in which two cars are traveling at constant speeds with one faster than the other. Pupils develop graphical representations to show the...
Balanced Assessment
Dinner Date
Determine just how far to run before dinner. The short assessment asks pupils to determine the distance a person can jog in the time left before dinner. To answer the question, scholars determine the distance if the person jogs one...
Balanced Assessment
Multi-Graphs
So many things change as time goes by. Here, scholars create graphs based on this premise. Each problem asks pupils to sketch a graph that describes a given situation. Their graphs represent various characteristics such as height,...
Concord Consortium
All-in-All Problems
Graphs, functions, symbols, and more! Use these strategies to model everything from the flow of a river to the number of cars passing a toll booth. Presented differently but solved similarly, learners consider five different scenarios...
Concord Consortium
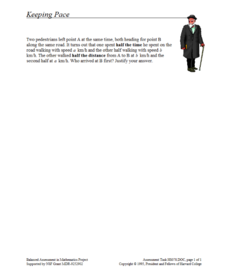
Keeping Pace
What came first, pedestrian one or pedestrian two? Scholars consider a problem scenario in which two people walk at different rates at different times. They must decide who reaches a checkpoint first. Their answers are likely to surprise...


