West Contra Costa Unified School District
Point-Slope Application Problems
Create a linear equation for a problem when the intercept information is not given. The two-day lesson introduces the class to the point-slope form, which can be used for problems when the initial conditions are not provided. Pupils...
EngageNY
Are All Parabolas Congruent?
Augment a unit on parabolas with an instructive math activity. Pupils graph parabolas by examining the relationship between the focus and directrix.
Inside Mathematics
Sorting Functions
Graph A goes with equation C, but table B. The short assessment task requires class members to match graphs with their corresponding tables, equations, and verbalized rules. Pupils then provide explanations on the process they used to...
CK-12 Foundation
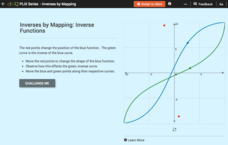
Inverses by Mapping: Inverse Functions
Map your way to successfully understanding inverse functions. Pupils use an interactive map to investigate how changes in the graph of a function affect the graph of its inverse. The results of the activity lead to the conclusion that...
CK-12 Foundation
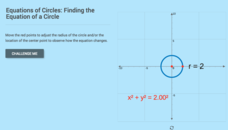
Equations of Circles: Finding the Equation of a Circle
It's all about location and size. With the aid of the interactive, pupils explore the relationship between the location and size of a circle and its equation. The learners use that relationship to determine the equation of a circle given...
Virginia Department of Education
Nonlinear Systems of Equations
Explore nonlinear systems through graphs and algebra. High schoolers begin by examining the different types of quadratic functions and their possible intersections. They then use algebraic methods to solve systems containing various...
Mathematics Vision Project
Module 4: Rational Functions
Time to study the most sensible function — rational functions! The seven-lesson unit develops the concept of a rational function through a connection to rational numbers and fractions. Scholars graph functions, solve equations, and...
EngageNY
Nature of Solutions of a System of Linear Equations
If at first you cannot graph, substitute. The lesson introduces the substitution method as a way to solve linear systems if the point of intersection is hard to determine from a graph. The 28th installment of a 33-part series finishes...
Concord Consortium
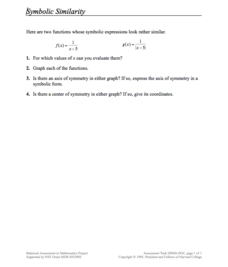
Symbolic Similarity
How many things does one transformation tell you? Learners compare and contrast the graphs of different parent functions with the same transformation. Using a rational and absolute value function, pupils identify key features of their...
Willow Tree
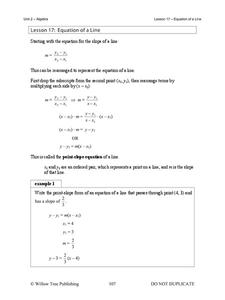
Equations of a Line
Each form of a linear equation has its purpose — pupils just have to find it. Building on the previous lesson in the series, learners examine point-slope and standard form. Using point-slope form, pupils write the equation of a...
NOAA
A Matter of Density
Larvae transportation on the New England seamounts is based on the density of the water. Scholars calculate density and graph salinity versus temperature to better understand the distribution of organisms in a water column....
Concord Consortium
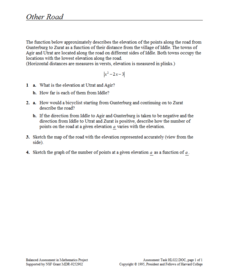
Other Road
Take the road to a greater knowledge of functions. Young mathematicians graph an absolute value function representing a road connecting several towns. Given a description, they identify the locations of the towns on the graph.
Concord Consortium
Shooting Arrows through a Hoop
The slope makes a difference. Given an equation of a circle and point, scholars determine the relationship of the slope of a line through the point and the number of intersections with the circle. After graphing the relationship, pupils...
CK-12 Foundation
Displaying Categorical Variables: Spending Habits
Bar or circle graph—which is best? Given a circle graph and a total amount of money earned, pupils calculate the amount of money in each category. Learners use the calculated amounts to create a bar graph and compare the two displays.
Concord Consortium
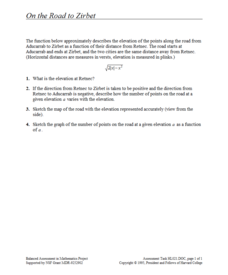
On the Road to Zirbet
The road to a greater knowledge of functions lies in the informative resource. Young mathematicians first graph a square root function in a short performance task. They then use given descriptions of towns and the key features of the...
CCSS Math Activities
Smarter Balanced Sample Items: High School Math – Target M
Your knowledge of graphs is a function of how much you try. Young mathematicians work on a set of 12 questions that covers graphing functions, comparing functions, and rewriting functions in different forms to determine key features....
CK-12 Foundation
Identification of Quadratic Models: UFO Launch
Build conceptual understanding of graphs of quadratic functions with an out-of-this-world resource. An interactive lesson allows learners to manipulate a graph that models the launch of a UFO. The lesson focuses on the key features of...
EngageNY
A Surprising Boost from Geometry
Working with imaginary numbers — this is where it gets complex! After exploring the graph of complex numbers, learners simplify them using addition, subtraction, and multiplication.
Shodor Education Foundation
Linear Inequalities
An interactive lesson helps individuals learn to graph inequalities in two variables. Scholars can adjust the interactive to present the inequalities in standard or slope-intercept form.
Concord Consortium
Betweenness II
Read between the curves ... quadratic curves! Young scholars analyze the graphs of two quadratic functions by writing their own function whose outputs are between the two given. They then consider intersecting quadratic functions and...
West Contra Costa Unified School District
Quadratic Equations — What We Know
Everything you could possibly want to know about quadratic equations, all in one resource. Instructors demonstrate how to translate between different forms of quadratics (equation, table of values, graph, verbal description) and finding...
Concord Consortium
Look but Do Not Touch
We seem to keep missing each other. A short task provides pupils with a quadratic function, as well as a linear function with a missing coefficient. They must determine the value of the coefficient for which the graphs do not intersect.
CK-12 Foundation
Intercepts by Substitution: Finding a Linear Product Using a Quadratic
Discover another way to interpret multiplication. Using an interactive, learners slide points (representing the factors of multiplication) along the x-axis of the graph of y = x^2 and observe changes in the line segment connecting the...
College Board
2008 AP® Microeconomics Free-Response Questions Form B
Vaccinations prevent disease, but do they impact anything else? Some may not realize they also have an economic impact. A set of questions from College Board asks learners to consider what, exactly, that impact is. Other practice prompts...


