Curated OER
Similarity and Dilations - Discover Properties of Similar Figures
Learners investigate properties of similar figures. For this properties of similar figures lesson, pupils construct similar figures using Cabri Jr. They dilate their figure to create a similar one, and discuss the relationships between...
Curated OER
Birds' Eggs
More than just data, scatter plots are full of information that can be used to answer a variety of questions. This lesson uses a plot with information about bird egg sizes to answer questions about the relationship between length and...
Pennsylvania Department of Education
Build What I've Created
n this geometric instructional activity, students define and identify two dimensional shapes based on their attributes. They complete worksheets based on the geometric concepts.
Curated OER
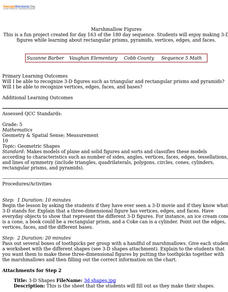
Marshmallow Figures
Students enjoy making 3-D figures while learning about rectangular prisms, pyramids, vertices, edges, and faces. After a lecture/demo, students use marshmallows, toothpicks and a worksheet imbedded in this lesson to create 3 dimensional...
Teach Engineering
Can You Take the Pressure?
Do not let the pressure get to you. The first lesson in a unit of 22 introduces the concept of air pressure. Using background knowledge, the resource gives teachers the information they need to discuss how people measure air pressure and...
Teach Engineering
Floaters and Sinkers
Whatever floats your boat. Young engineers learn about density by measuring the masses and volumes of boxes filled with different materials. Using their knowledge of densities, they hypothesize whether objects with given densities will...
Teach Engineering
Flow Rates of Faucets and Rivers
Go with the flow and use a helpful resource. A set of two activities has learners investigate flow rates. They first determine the flow rate of a faucet by measuring how long it takes to fill a bucket. Using the results, they make a...
Curated OER
Goal Setting
Students understand how they can incorporate dietary guidelines in their daily life. In this investigative lesson students set dietary goals and incorporate an activity to learn how to create a new seed variety while studying...
Mathematics Assessment Project
Designing a 3d Product in 2d: a Sports Bag
Sew up pupil interest with an engaging, hands-on lesson. Learners first design a sports bag given constraints on the dimensions of fabric. They then evaluate provided sample responses to identify strengths and weaknesses of included...
Curated OER
Action-Reaction! Rocket
Students construct a rocket from a balloon propelled along a guide string. They use this model to learn about Newton's three laws of motion, examining the effect of different forces on the motion of the rocket. They measure the distance...
Curated OER
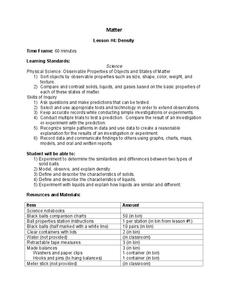
Density
Learners predict when an object will float or sink based on comparison of density of the object to the density of the substance in which it is placed. The access a website and sketch the object in the first column of their table and then...
Curated OER
How Credit Card Interest Works
Students experiment with an Excel spreadsheet model that demonstrates the effects of interest on payments. They calculate actual costs, interest paid, and time necessary to pay off credit purchases and draw conclusions about the...
Curated OER
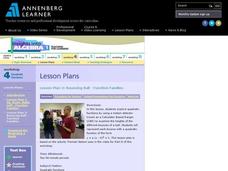
Bouncing Ball : Function Families
A bouncing ball serves as more than entertainment when learning to apply quadratic functions to real-world events. This is the second of a two-part activity, which can also be accessed from the website. The instructions say to measure...
University of Colorado
Great Red Spot Pinwheel
The great red spot on Jupiter is 12,400 miles long and 7,500 miles wide. In this sixth part of a 22-part series, individuals model the rotation of the Great Red Spot on Jupiter. To round out the activity, they discuss their findings as a...
Curated OER
Let's Plot Points
Use coordinate grid paper to plot points and identify shapes that are already plotted on the paper by saying their coordinates. Pupils also measure the distance between points and play the game Battleship. There are several web links and...
Curated OER
Massive Migrations
Here is an exciting exploration of a fascinating topic for your emerging ecologists: bird migration! They begin by visiting the US Fish & Wildlife Service website to discover which Arctic birds come to their areas. They are assigned...
American Statistical Association
An A-MAZE-ING Comparison
Teach your class how to use descriptive statistics through a hands-on data collection activity. Pupils collect their own data, calculate test statistics, and interpret the results in context. They compare male and female results, looking...
Statistics Education Web
How High Can You Jump?
How high can your pupils jump? Learners design an experiment to answer this question. After collecting the data, they create box plots and scatter plots to analyze the data. To finish the lesson, they use the data to draw conclusions.
Statistics Education Web
Using Dice to Introduce Sampling Distributions
Investigate the meaning of a sample proportion using this hands-on activity. Scholars collect data and realize that the larger the sample size the more closely the data resembles a normal distribution. They compare the sample proportion...
Curated OER
Pythagorean Theorem by Graphic Manipulation
There are many different ways to show a proof of the Pythagorean Theorem. Here is a nice hands-on paper cutting activity that shows a graphic representation. You can even challenge your young Pythagoreans to come up with their own...
Curated OER
The Gum Drop
Students find the area of three figure by the traditional formulaic methods. Then they count the number of grid squares to double check. They show an intuitive sense of Pick's Algorithm by counting every two boundary squares as one unit....
Curated OER
Putting the Pieces Together
Children explore fractions on a conceptual level by making individual quilt squares. Each student works with small paper swatches to divide them into pieces that represent a given fraction. The class is then separated into groups and...
Statistics Education Web
When 95% Accurate Isn’t
Investigate the effect of false positives on probability calculation with an activity that asks scholars to collect simulated data generated by a calculator. To finish, participants analyze the probability of certain outcomes which lead...
Curated OER
Long Day?
Students become aware of the effects of tides on the Earth's rotation. For this tides lesson, students calculate the number of seconds lost over various periods of time.


