Math Worksheets Land
Patterns of Association (Using Data Tables) - Step-by-Step Lesson
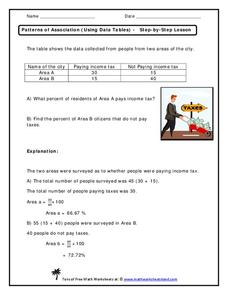
This worksheet belongs to a four-part resource that gathers information from data tables to calculate percentages. The page introduces one problem and shares an explanation to the answer.
Code.org
Making Data Visualizations
Relax ... now visualize the data. Introduce pupils to creating charts from a single data set. Using chart tools included in spreadsheet programs class members create data visualizations that display data. The...
Charleston School District
Two-Way Tables
Do males or females buy more iPhones? Using a two-way frequency table can help to answer this question. Pupils learn to create two-way frequency tables and then how to analyze the data within the tables. Learners find frequencies,...
Willow Tree
Linear Relationships
There's just something special about lines in algebra. Introduce your classes to linear equations by analyzing the linear relationship. Young mathematicians use input/output pairs to determine the slope and the slope-intercept formula to...
Willow Tree
Scatterplots and Stem-and-Leaf Plots
Is there a correlation between the number of cats you own and your age? Use a scatter plot to analyze these correlation questions. Learners plot data and look for positive, negative, or no correlation, then create stem-and-leaf plots to...
Towson University
Looking Backwards, Looking Forward
How do scientists know what Earth's climate was like millions of years ago? Young environmental scholars discover how researchers used proxy data to determine the conditions present before written record. Grouped pupils gain experience...
Teach Engineering
Maximum Power Point
Investigate the maximum power output of a photovoltaic panel with a instructional activity that introduces the class to the maximum power point. Individuals learn how to determine the maximum power point of a solar panel by using Ohm's...
Towson University
Mystery Disease
How did scientists determine the cause of illness before technology? Science scholars play the role of medical researcher in an engaging guided inquiry activity. Using observations, technical reading, and Punnett squares, learners...
Willow Tree
Histograms and Venn Diagrams
There are many different options for graphing data, which can be overwhelming even for experienced mathematcians. This time, the focus is on histograms and Venn diagrams that highlight the frequency of a range of data and overlap of...
Willow Tree
Circle Graphs
Pie isn't just for eating! Scholars learn to create pie charts and circle graphs to represent data. Given raw data, learners determine the percent of the whole for each category and then figure out the degree of the circle that percent...
Willow Tree
Bar Graphs
Circles, lines, dots, boxes: graphs come in all shapes in sizes. Scholars learn how to make a bar graph using univariate data. They also analyze data using those bar graphs.
Willow Tree
Line Graphs
Some data just doesn't follow a straight path. Learners use line graphs to represent data that changes over time. They use the graphs to analyze the data and make conclusions.
Towson University
The Crucial Concentration
Which sports drink provides the best pick-me-up after the big game or grueling workout? It may not be the one you'd think! Food science is the focus in a surprising lab activity. Pupils use colorimetry to determine the amount of protein,...
Towson University
It's a Gassy World!
How much does your class know about the relationship between climate change and carbon dioxide? Science scholars explore the nature of greenhouse gases and rising ocean temperature through demonstrations, research, and experiments. The...
Towson University
Case of the Crown Jewels
Can your biology class crack the Case of the Crown Jewels? Junior forensics experts try their hands at DNA restriction analysis in an exciting lab activity. The lesson introduces the concept of restriction analysis, teaches pipetting and...
Curated OER
Conversion Factors Data
In this mathematics worksheet, students use this as a resource for looking up conversion tables for mathematical and scientific data.
Laboratory for Atmospheric and Space Physics
The Planets and Scale
Scholars gain an insight into the relative size of planets and distance between inner and outer planets with the help of informational text, a data table, and a series of four questions.
Towson University
Mystery Tubes
How do scientists know they're right? Truth be told, they don't always know. Explore the scientific process using mystery tubes in an insightful activity. Young scientists discover how to approach and solve problems in science, how ideas...
Towson University
Mystery of the Crooked Cell
Can your class solve the Mystery of the Crooked Cell? Junior geneticists collaborate to learn about sickle cell anemia in a fascinating lesson plan. The included materials help them to examine the genetic factors behind the disease...
Towson University
The Wildlife Forensics Lab
Can science put an end to the poaching of endangered species? Show your young forensic experts how biotechnology can help save wildlife through an exciting electrophoresis lab. Grouped pupils analyze shark DNA to determine if it came...
Chemical Education Foundation
Teacher's Guide to Science Projects
Do you find the idea of having a science fair with all of your students intimidating? Use a guide that provides everything you need to know to make project-based learning manageable. The resource includes options for four...
It's About Time
Volcanic Hazards: Airborne Debris
Pupils interpret maps and graph data related to volcanic ash. Then they analyze the importance of wind speed and the dangers of the ash to both life, air temperature, and technology.
University of Georgia
Would Your Cat Eat This Stuff?
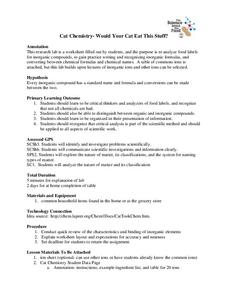
Processed foods use inorganic compounds for flavoring and preservation. This take-home laboratory challenges scholars to find 20 different compounds identified on the labels of foods to list on their data collection sheet. The activity...
Agriculture in the Classroom
A Holiday Tradition: Which Christmas Tree Will You Choose?
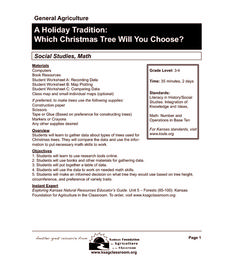
Different varieties of Christmas trees provide an interesting way to combine social studies, science, math, and technology. Class members not only research the history of the Christmas tree holiday tradition, they compare and...


