Teach Engineering
Club Function
Let's get the herd to follow the rules. The activity associated with the second lesson in the unit introduces the class to the definition of a function. Individuals must gather in groups of zebras and rhinos defined by the general...
Teach Engineering
Coordinates and the Cartesian Plane
The plot thickens to get a functional understanding. After a short review of plotting points on the coordinate plane, class members learn the difference between functions and relations in the second lesson in a series of nine. They show...
EngageNY
Graphing the Logarithmic Function
Teach collaboration and communication skills in addition to graphing logarithmic functions. Scholars in different groups graph different logarithmic functions by hand using provided coordinate points. These graphs provide the basis for...
Urbana School District
Projectile and Circular Motion, Torque
Introduce your young scholars to the concepts of circular motion, projectile motion, angular speed, simple harmonic motion, torque, center of mass, centripetal force, and Hooke's Law with a 86-slide presentation. The circular motion...
Math Worksheets Land
Zombie's Mean, Median, Mode, and Range
Given four sets of data, zombie-loving mathematicians find the mode, range, mean, and median for each set. The sheet is more challenging if calculators are not used; but the data set with large numbers may require a calculator.
Mathematics Assessment Project
Temperatures
As a middle school assessment task, learners first examine line graphs of monthly temperatures for two locations, and then match box plots to each line plot.
EngageNY
Distributions—Center, Shape, and Spread
Data starts to tell a story when it takes shape. Learners describe skewed and symmetric data. They then use the graphs to estimate mean and standard deviation.
EngageNY
Graphing the Tangent Function
Help learners discover the unique characteristics of the tangent function. Working in teams, pupils create tables of values for different intervals of the tangent function. Through teamwork, they discover the periodicity, frequency, and...
EngageNY
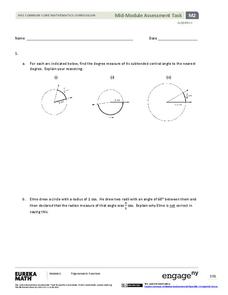
Algebra II Module 2: Mid-Module Assessment
Time for classes to show what they've learned. Use several tasks to assess understanding of the trigonometric functions, unit circle, radians, and basic trigonometric identities.
EngageNY
Basic Trigonometric Identities from Graphs
Have young mathematicians create new identities! They explore the even/odd, cofunction, and periodicity identities through an analysis of tables and graph. Next, learners discover the relationships while strengthening their understanding...
EngageNY
Secant and the Co-Functions
Turn your class upside down as they explore the reciprocal functions. Scholars use the unit circle to develop the definition of the secant and cosecant functions. They analyze the domain, range, and end behavior of each function.
EngageNY
Extending the Domain of Sine and Cosine to All Real Numbers
Round and round we go! Pupils use reference angles to evaluate common sine and cosine values of angles greater than 360 degrees. Once they have mastered the reference angle, learners repeat the process with negative angles.
Willow Tree
Extremes, Range, and Quartiles
The middle of the data is important, but what about the rest of it? The lesson shows learners the importance of the range, quartiles, and extreme values. Pupils practice finding each of these values from given data sets.
Willow Tree
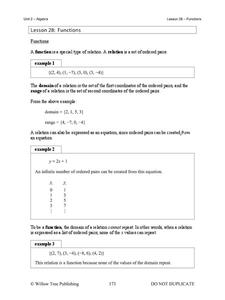
Functions
What makes a function a function? Learn the criteria for a relation defined as a function both numerically and graphically. Once young mathematicians define a function, they use function notation to evaluate it.
Mathed Up!
Mean, Median, Mode, and Range
Learners read a variety of word problems and find the mode, median, range, and mode from a given set of data. If calculators are not desirable, provide the class with notebook paper to work out the equations.
Jordan-Granite Consortium
Scatter Diagram
You aced the first test, so your score on the second one shouldn't matter, right? Young pupils first draw a best fit line on a provided scatter plot showing test scores for two different tests. They then evaluate five statements on the...
Charleston School District
Review Unit 3: Functions
Time to show what you know about functions! The review concludes a series of nine lessons on the basics of functions. The problems included are modeled from the previous lessons. Pupils determine if a table represents a function,...
Charleston School District
Intro to Functions
How are functions related to chicken nuggets? A video teaches the concept of a function using the idea of a nugget-making machine as an analogy for a function machine. Learners determine if a relation is a function from an equation and a...
Los Angeles County Office of Education
Assessment For The California Mathematics Standards Grade 6
Test your scholars' knowledge of a multitude of concepts with an assessment aligned to the California math standards. Using the exam, class members show what they know about the four operations, positive and negative numbers, statistics...
Houghton Mifflin Harcourt
Unit 3 Math Vocabulary Cards (Grade 5)
Fifty-four flashcards make up a set to help reinforce math vocabulary. The set offers two types of cards; a word card printed in bold font, and a definition card equipped with an example and labels. Terms include capacity, histogram,...
NASA
Weightless Wonder
A video of the weightless wonder provides a setting for the math to follow. Groups analyze the graph of a quadratic function that models the path of the C-9 as it gives astronauts the experience of weightlessness. Using a graphing...
Curated OER
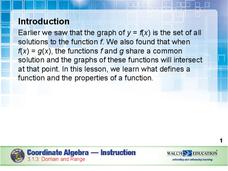
Domain and Range
Relations, and functions, and line tests, oh my! An instructional slideshow demonstrates the definitions of a relation, a function, and the domain and range of a relation. Viewers then learn how to use mappings and vertical line tests to...
West Contra Costa Unified School District
Key Features of Graphs
The key is ... After a day of instruction on key features of graphs, groups create a poster and presentation on the key features of their given function graph. The resource provides an extension activity of "telephone" using graphs.
EngageNY
Representing, Naming, and Evaluating Functions (Part 2)
Notation in mathematics can be intimidating. Use this lesson to expose pupils to the various ways of representing a function and the accompanying notation. The material also addresses the importance of including a domain if necessary....


