EngageNY
More on Modeling Relationships with a Line
How do you create a residual plot? Work as a class and in small groups through the activity in order to learn how to build a residual plot. The activity builds upon previous learning on calculating residuals and serves as a precursor to...
Teach Engineering
Designing Bridges
Introduces your class to the types of loads experienced by a bridge. Groups calculate the ultimate load combinations to determine the maximum load requirement. Using this information, builders then determine the amount of material they...
EngageNY
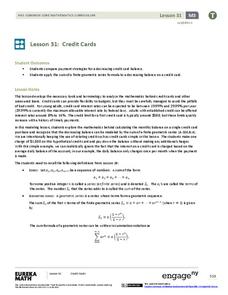
Buying a Car
Future car owners use geometric sums to calculate payments for a car loan in the 31st installment of a 35-part module. These same concepts provide the basis for calculating annuity payments.
National Research Center for Career and Technical Education
Depreciation (Double Declining)
Have you ever been told that your new car begins to lose its value as soon as you drive it off the lot? Aspiring accountants take on the concepts of depreciation and book value through an easy-to-deliver career and technology...
Teach Engineering
Both Fields at Once?
An MRI uses both a magnetic and electricity, so how do the two interact with each other? Class members observe the effects on a charged particle when it is subject to both an electrical and magnetic field. The teacher background...
Curated OER
Calculating the Cost of Living
Bring Consumer Mathematics and Economics to life with this lesson, where learners investigate personal finance and budgeting. They use the newspaper’s classified section to determine a future job and potential earnings and determine a...
EngageNY
Normal Distributions (part 1)
Don't allow your pupils to become outliers! As learners examine normal distributions by calculating z-scores, they compare outcomes by analyzing the z-scores for each.
EngageNY
Margin of Error When Estimating a Population Mean (part 2)
Don't leave your classes vulnerable in their calculations! Help them understand the importance of calculating a margin of error to represent the variability in their sample mean.
National Sailing Hall of Fame
Sailboat Design Requirements
Sailboat design requires more than a half-circle and triangle sketch. After viewing a slideshow presentation that outlines the requirements for sailboat design, learners draw a design, perform the needed calculations, and write a paper...
Virginia Department of Education
Calculating Measures of Dispersion
Double the fun — calculate two measures of deviation. The lesson plan provides information to lead the class through the process of calculating the mean absolute deviation and the standard deviation of a data set. After learning how to...
EngageNY
Determining Discrete Probability Distributions 2
Investigate how long-run outcomes approach the calculated probability distribution. The 10th installment of a 21-part module continues work on probability distributions from the previous lesson. They pool class data to see how conducting...
Teach Engineering
Just Plane Simple
It is plane to see that simple machines help reduce the force needed to perform a task. This resource introduces three of the simple machines--the inclined plane, the wedge, and the screw, and the formulas in order to be able to...
Curated OER
Calculating Stride Length
How many steps does one take to walk a mile? The number of steps one walks in a mile would definitely depend on the length of his stride. Shorter people may take shorter strides, and taller people may take longer strides. This activity...
Teach Engineering
Graphing Equations on the Cartesian Plane: Slope
Slopes are not just for skiing. Instructors introduce class members to the concept of slope and teach them how to calculate the slope from a graph or from points. The lesson also includes the discussion of slopes of parallel and...
EngageNY
Credit Cards
Teach adolescents to use credit responsibly. The 32nd installment of a 35-part module covers how to calculate credit card payments using a geometric series. It teaches terminology and concepts necessary to understand credit card debt.
Teach Engineering
Viscous Fluids
Elasticity and viscosity. Help your class understand the similarities and differences with an introduction to viscous fluids. After describing four types of fluid behaviors: shear thinning, shear thickening, Bringham plastic, and...
Curated OER
All in the Family: Calculating Cousins
Students view pictures of distant "cousins" to humans. They place them in order by their distance from humans. Students receive a packet of six pages featuring graphics and a cousins summary page. They work in groups to complete 5 cousin...
Education Institute
Four Mathematics Lessons for Grade 9
These four lesson plans build algebra skills for working with numbers in exponential form and for examining triangles. Be aware that in the text, scientific notation is referred to as index notation and the laws of exponents as the laws...
Curated OER
Calorie Calculations through Beach Activities
Beach activity separates babes from blobs! Your class learns about calculating the number of calories used during physical activity. A worksheet is provided in which the activity of five different people at the beach is listed for...
EngageNY
Graphs of Linear Functions and Rate of Change
Discover an important property of linear functions. Learners use the slope formula to calculate the rates of change of linear functions. They find that linear functions have constant rates of change and use this property to determine if...
EngageNY
Estimating Probabilities by Collecting Data
Take a spin to determine experimental probability. Small groups spin a spinner and keep track of the sums of the spins and calculate the resulting probabilities. Pupils use simulated frequencies to practice finding other probabilities to...
Teach Engineering
A Good Foundation
It takes a strong foundation to build a house and a stronger one for a bridge. This resource presents the effects of geology and soil on bridge foundations. Working in groups, the class investigates the interaction of shallow and deep...
Baylor College
Calculating Exponential Growth
There can be a steep learning curve when teaching about exponential growth, but the lesson helps kids make sense out of the concept. When talking about exponential growth of viruses, learners may not be very interested, but when you are...
EngageNY
Lines That Pass Through Regions
Good things happen when algebra and geometry get together! Continue the exploration of coordinate geometry in the third lesson in the series. Pupils explore linear equations and describe the points of intersection with a given polygon as...


