Mathematics Assessment Project
Interpreting Distance–Time Graphs
Pre-algebra protégés critique a graph depicting Tom's trip to the bus stop. They work together to match descriptive cards to distance-time graph cards and data table cards, all of which are provided for you so you can make copies for...
Curated OER
Interpreting Algebraic Expressions
Interpreting algebraic expressions is a fundamental skill in beginning algebra. This instructional activity approaches the task in numerous ways. First, learners assess their understanding with a short worksheet on converting between...
MARS - Mathematics Assessment Resource Service
Applying Properties of Exponents
The properties of exponents are all linked together and it is your mathematicians' job to discover and apply those rules. The comprehensive lesson begins with a pre-assessment task to check for prior knowledge and then goes into a...
Mathematics Assessment Project
Representing 3-D Objects in 2-D
How does the shape of the surface of water in a container change as water leaks out? After tackling this question, learners take part in a similar activity with more complex figures.
02 x 02 Worksheets
Dividing Polynomials Using Algebra Tiles
Discover how algebra tiles can help in dividing polynomials. Pupils watch as instructors demonstrate how to use algebra tiles to solve problems involving the division of a quadratic expression by a linear expression. Once they get the...
Curated OER
Integer Intro
Read a series of word problems and have your class identify the process to solve them. They practice identifying, comparing, and ordering integers. They focus on recognizing opposites and the absolute value of number. An assessment...
Mathematics Assessment Project
Estimating Volume: The Money Munchers
Don't stuff money under your mattress. To find out why learners first complete a task determining how $24,000 in cash would affect the height of a mattress and whether this same amount would fit into a suitcase of given dimensions....
Chicago Botanic Garden
Are You Bigfoot?
Scholars independently explore several websites to calculate their ecological footprint. Using their new found knowledge, they answer six short-answer questions and take part in a grand conversation with their peers about how...
Virginia Department of Education
Functions: Domain, Range, End Behavior, Increasing or Decreasing
Examine key features of various functions through exploration. A comprehensive instructional activity has learners describe the domain, range, end behavior and increasing/decreasing intervals of various functions. Function types include...
Virginia Department of Education
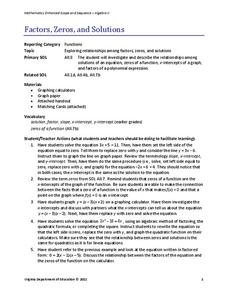
Factors, Zeros, and Solutions
Factors, zeros, and solutions, oh my! Don't let your classes become overwhelmed with the vocabulary. An engaging instructional activity helps learners make a connection between factors, zeros, and solutions. Pupils explore the...
Virginia Department of Education
Solving and Graphing Inequalities
You can't go wrong with a lesson that involves candy! Learners solve and graph one-variable inequalities and use candy to graph the solution. Individuals associate open circle graphs with life savers and closed circle graphs with round...
Virginia Department of Education
Probability
Classes explore different scenarios using manipulatives to learn about the difference between independent and dependent probability. Learners experiment with colored chips to model the two types of probabilities. To test their...
Virginia Department of Education
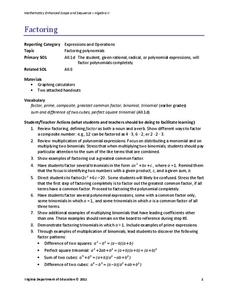
Factoring
Uncover the relationship between factoring quadratics and higher degree polynomials. Learners develop their factoring skills through repetition. A comprehensive activity begins with quadratics and shows how to use the same patterns to...
Curated OER
Transformations and Matrices
There are four activities in this extensive instructional activity covering the identity matrix and scaling, the linear representation of translations, the linear representation of rotations, and reflections. In small groups, they use...
Philadelphia Museum of Art
Physics at the Art Museum: Kinetic Energy, Potential Energy, and Work
Connect science, math, and art for a true interdisciplinary lesson! Learners explore simple machines in art. Through analysis with a physics app, they identify positions of kinetic and potential energy and make conclusions about work.
Curated OER
Fourth Grade Math: Geometry
In this math assessment worksheet, learners answer 5 multiple choice geometry questions. The assessment is on the fourth grade level.
Statistics Education Web
First Day Statistics Activity—Grouping Qualitative Data
Making groups of groups can help to organize data. Classes use statistics to group themselves using descriptive adjectives. The objective is for learners to understand that grouping qualitative data is useful when the original groups are...
Project Maths
Introduction to Patterns
The world is full of patterns. Help learners quantify those patterns with mathematical representations. The first Algebra lesson in a compilation of four uses a series of activities to build the concept of patterns using multiple...
American Statistical Association
How Tall and How Many?
Is there a relationship between height and the number of siblings? Classmates collect data on their heights and numbers of brothers and sisters. They apply statistical methods to determine if such a relationship exists.
Statistics Education Web
Types of Average Sampling: "Household Words" to Dwell On
Show your classes how different means can represent the same data. Individuals collect household size data and calculate the mean. Pupils learn how handling of the data influences the value of the mean.
Statistics Education Web
Walk the Line
How confident are you? Explore the meaning of a confidence interval using class collected data. Learners analyze data and follow the steps to determine a 95 percent confidence interval. They then interpret the meaning of the confidence...
Statistics Education Web
Odd or Even? The Addition and Complement Principles of Probability
Odd or even—fifty-fifty chance? Pupils first conduct an experiment rolling a pair of dice to generate data in a probability lesson. It goes on to introduce mutually exclusive and non-mutually exclusive events, and how to use the...
Statistics Education Web
Are Female Hurricanes Deadlier than Male Hurricanes?
The battle of the sexes? Scholars first examine data on hurricane-related deaths and create graphical displays. They then use the data and displays to consider whether hurricanes with female names result in more deaths than hurricanes...
Statistics Education Web
The Case of the Careless Zookeeper
Herbivores and carnivores just don't get along. Using a box of animal crackers, classes collect data about the injury status of herbivores and carnivores in the box. They complete the process of chi-square testing on the data from...


