Teach Engineering
Energy Skate Park
Skate through a simulation on energy with an a activity that uses a computer simulation of a skater to reinforce the concept of conservation of energy. The resource guides pupils through scenarios using the computer simulation to see the...
EngageNY
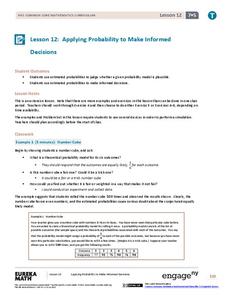
Applying Probability to Make Informed Decisions
Use simulations to determine the probabilities of events to make decisions. Class members are presented with several scenarios, some with known probabilities and others without. Groups run simulations to gather data that they then use to...
NOAA
Sustaining Our Ocean Resources
Lead young scientists on an investigation of fishery practices with the final installment of this four-part unit. Using a PowerPoint presentation and hands-on simulation, this activity engages children in learning how fish populations...
PBS
Adventures With The Fish Pond: Population Modeling
Build up from the previous activity where your learners charted the population growth and decay of a fish pond with M&Ms®. Have them look at the data from that activity and create a Now-Next, or recursive equations, to predict the...
EngageNY
Mid-Module Assessment Task: Grade 7 Mathematics Module 5
Determine the probability that the class knows probability. The three-question assessment presents problems with finding the sample space and the probability, theoretical and experimental, of a variety of situations. Pupils also describe...
EngageNY
End-of-Module Assessment Task: Grade 7 Mathematics Module 5
Show learners how to use simulations and random sampling to reach conclusions with the last resource in a 25-part series. The assessment contains three scenarios, each with several parts, and covers comparing populations using random...
Teach Engineering
Earthquakes Living Lab: Finding Epicenters and Measuring Magnitudes
Pairs use an online simulation to determine the epicenter and magnitude of an earthquake. Using real data about the earthquake's maximum S wave amplitudes, they then determine the magnitude. The resource provides a great career...
EngageNY
Estimating Probabilities by Collecting Data
Take a spin to determine experimental probability. Small groups spin a spinner and keep track of the sums of the spins and calculate the resulting probabilities. Pupils use simulated frequencies to practice finding other probabilities to...
EngageNY
The Difference Between Theoretical Probabilities and Estimated Probabilities
Flip a coin to determine whether the probability of heads is one-half. Pupils use simulated data to find the experimental probability of flipping a coin. Participants compare the long run relative frequency with the known theoretical...
CK-12 Foundation
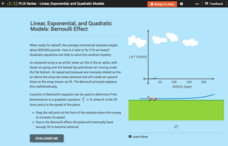
Linear, Exponential, and Quadratic Models: Bernoulli Effect
How can an object as heavy as an airplane fly? Turns out the answer is quadratic! Your classes explore the Bernoulli Effect through an interactive graph representation. As a plane increases in speed, the lift force also increases. Young...
CK-12 Foundation
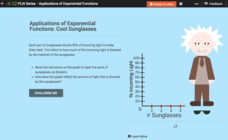
Exponential Decay: Cool Sunglasses
Who wouldn't want to wear four pairs of sunglasses? Each pair of sunglasses reduces the percent of incoming light by one-half. An interactive tutorial helps young mathematicians build a graph that models this scenario. They then explore...
PHET
My Solar System
Orbit diagrams appear to be a work of mathematical art. The simulation helps scholars build their own systems of planets, stars, moons, etc., to observe their orbits. By altering their positions, velocities, and masses, a variety of...
Curated OER
Go Fish
Help learners discover methods to estimate animal population. They will participate in a simulation of catching and tagging fish in order to estimate the fish population. They scoop and count goldfish crackers, record data, and use...
Curated OER
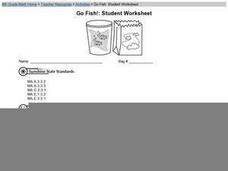
Go Fish! Student Worksheet
A math and science instructional activity prompts learners to simulate how scientists determine populations of animals out in the wild. They use goldfish crackers, paper bags, and a styrofoam cup as their tools. An excellent cooperative...
Curated OER
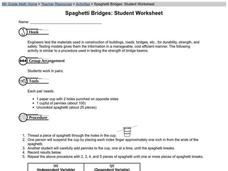
Spaghetti Bridges: Student Worksheet
Pairs of learners work together in order to simulate how engineers test materials for strength and safety in the real world. They use paper cups and pieces of spaghetti to run strength tests. This excellent worksheet should lead to...
Curated OER
Lesson 9: Tracking Commodities
Over the corse of a month, small groups will monitor the price of a specific energy commodity and analyze it in relation to global and domestic events. They play a trade simulation game and create infographics showing what they've...
EngageNY
Sampling Variability in the Sample Mean (part 2)
Reduce variability for more accurate statistics. Through simulation, learners examine sample data and calculate a sample mean. They understand that increasing the number of samples creates results that are more representative of the...
Illustrative Mathematics
Block Scheduling
If a random sample determines that 45% of students favor block scheduling, is it possible that the actual percentage might be 50% or 60%? In this task, learners use data from a computer-generated simulation to determine the plausibility...
Curated OER
Chances Are......You're Right
Young mathematicians study probability. In this math lesson, learners calculate odds, and convert those into percentages of probability. Fractions are also used, making this lesson quite rich in some of the more difficult conversions...
Curated OER
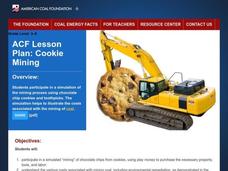
Cookie Mining
Students simulate coal mining with chocolate chip cookies and toothpicks. They investigate the costs associated with mining coal.
Curated OER
Coal Supply and Demand
A hands-on simulation perfect for an economics lesson, young learners investigate the availability of different sources of natural energy (coal, natural gas, oil, solar, and nuclear) and how this availability affects their cost. Simulate...
Curated OER
Get the Picture!
Astronomers practice downloading data from a high-energy satellite and translate the data into colored or shaded pixels. As a hands-on activity, they use pennies to simulate high-energy satellite data and they convert their penny...
Curated OER
How Many?
Middle schoolers explore and design ways to collect data through simulations and random samples. They perform two experiments to determine the answers to various probability problems, and present the data/graphs in the form of a...
Statistics Education Web
When 95% Accurate Isn’t
Investigate the effect of false positives on probability calculation with an activity that asks scholars to collect simulated data generated by a calculator. To finish, participants analyze the probability of certain outcomes which lead...
Other popular searches
- Consumer Math Simulations
- Math Simulations Fractions
- Math Simulations on Line
- Life Math Simulations
- Math Simulations Online
- Math Simulations Sets
- Math Simulations Roots
- Math Simulations Rots
- Simulation Math
- Math Simulation Lessons
- Simulation Math Activities
- Real Math Simulations


