Virginia Department of Education
Distance and Midpoint Formulas
Small groups work through two guided activities to derive the distance and midpoint formulas for the coordinate plane. The activities begin with concrete examples and move to abstract.
National Institute of Food and Agriculture
Water Supply
Participate in three activities that look at the earth's limited water supply and the changes water goes through as it enters each phase of the water cycle. The resource is complete with three activities that demonstrate the changing...
EngageNY
The Distance Between Two Rational Numbers
There has to be a better way than counting. Pupils find the distance on a number line between rational numbers by counting the number of intervals. Through a discussion, the class sees the connection between absolute value and the...
American Statistical Association
How Tall and How Many?
Is there a relationship between height and the number of siblings? Classmates collect data on their heights and numbers of brothers and sisters. They apply statistical methods to determine if such a relationship exists.
American Statistical Association
You and Michael
Investigate the relationship between height and arm span. Young statisticians measure the heights and arm spans of each class member and create a scatter plot using the data. They draw a line of best fit and use its slope to explain the...
Point Pleasant Beach School District
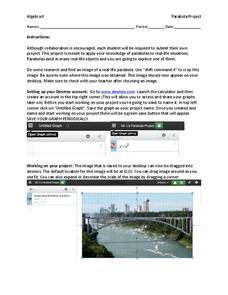
Parabola Project
Class members select a picture that contains a parabola and construct a drawing of it using function graphs in the quadratic project. Individuals restrict the domains of the functions to create a more accurate drawing. They then submit a...
Curated OER
Buying Coffee
Starbucks or house blend? Pupils analyze the unit rate as the cost per pound of coffee. They use a graph to visualize the unit rate given the cost for a quantity other than one pound.
Mathematics Assessment Project
Modeling Motion: Rolling Cups
Connect the size of a rolling cup to the size of circle it makes. Pupils view videos of cups of different sizes rolling in a circle. Using the videos and additional data, they attempt to determine a relationship between cup...
Mathed Up!
Scatter Graphs
Make an estimate by getting in line. The class works with scatter plots and lines of best fit to make an estimate for given values. Pupils determine whether there is a positive or negative correlation and draw a best-fit line. Using the...
Mathed Up!
Two Way Tables
When presented with categorical data, a two-way frequency table is a great way to summarize the information. Pupils organize categorical data using a two-way table, then use the tables to determine missing data and to calculate simple...
Mathed Up!
Nets, Plans, and Elevations
A dimensional resource teaches viewers to recognize 2-D views of 3-D objects and how to match nets with their 3-D figures. Individuals draw different views of three-dimensional objects including views from the front, side...
Mathed Up!
Mixed Transformations
Viewers learn how to identify and perform a variety of transformations with a video that provides seven items on transformations. Pupils demonstrate their understanding of dilations, reflections, rotations, and translations. The video...
Mathed Up!
Translations
Introduce translations as transformations that move figures in horizontal and vertical distances with a video that shows how to translate the figures. A second video covers how to determine the translation that has occurred. Pupils...
Mathed Up!
Enlargements
Make enlargements with and without centers. Pupils work through seven problems dealing with dilations or enlargements. The first couple items are strict enlargements without centers, while the others have centers. Class members also...
Mathed Up!
Reflections
Tracing paper is not just for art anymore — pupils can use it to find reflected images, too! Two videos show how to reflect images using tracing paper and find the reflection between the pre-image and image. Learners perform reflections...
Mathed Up!
Rotation
Two videos show first how to perform a rotation, given the center, the angle, and the direction of rotations. Individuals then see how to find what the rotation is from one figure to another. Pupils practice doing both in seven problems...
EngageNY
Understanding Addition of Integers
Count up or down to find sums. The third lesson in a 25-part series uses number lines to build an understanding of the sums of integers. Pupils make the connection between the distance and direction of a sum from the first addend, then...
American Statistical Association
An A-MAZE-ING Comparison
Teach your class how to use descriptive statistics through a hands-on data collection activity. Pupils collect their own data, calculate test statistics, and interpret the results in context. They compare male and female results, looking...
Statistics Education Web
It Creeps. It Crawls. Watch Out For The Blob!
How do you find the area of an irregular shape? Class members calculate the area of an irregular shape by finding the area of a random sampling of the shape. Individuals then utilize a confidence interval to improve accuracy and use a...
Statistics Education Web
It’s Elemental! Sampling from the Periodic Table
How random is random? Demonstrate the different random sampling methods using a hands-on activity. Pupils use various sampling techniques to choose a random sample of elements from the periodic table. They use the different samples to...
Statistics Education Web
Using Dice to Introduce Sampling Distributions
Investigate the meaning of a sample proportion using this hands-on activity. Scholars collect data and realize that the larger the sample size the more closely the data resembles a normal distribution. They compare the sample proportion...
Statistics Education Web
How High Can You Jump?
How high can your pupils jump? Learners design an experiment to answer this question. After collecting the data, they create box plots and scatter plots to analyze the data. To finish the lesson, they use the data to draw conclusions.
Statistics Education Web
Sampling in Archaeology
Compare different random sampling types using an archaeological setting. Scholars collect data from an archaeological plot using simple random samples, stratified random samples, systematic random samples, and cluster random samples....
American Statistical Association
Colors Challenge!
Does writing the name of a color in a different colored ink affect one's ability to read it? Scholars design an experiment to answer this question. They collect the data, analyze the statistics, and draw a conclusion based on...


